Здесь можно скачать тестовые фотографические миры.
к содержанию ↑
ISO 12233
[lock][download id=154][/lock]
Описание изображения:
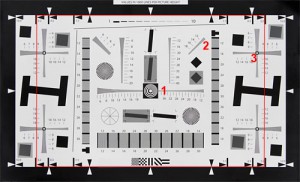
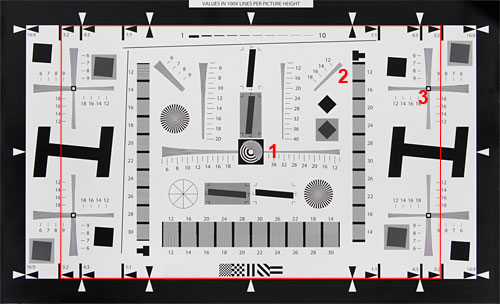
The Digital Still-Camera Resolution Chart contains a variety of test pattern
elements. Users are advised to refer to International Standard ISO-12233 for a
detailed explanation of the target’s features and their use. The following is a
summary list of image features.
• Framing arrows, which define 1:1, 4:3, 3:2 and 16:9 aspect ratios, assist in
framing the target’s active area.
• A central dual-frequency zone plate on a black square can be used to set focus.
• Central hyperbolic wedges measure resolving power from 100 to 2000 line
widths per picture height (lw/ph). Corner wedges measure from 100 to 1000
lw/ph. Horizontal, vertical and diagonal oriented wedges are included for
comparison of resolving power at various locations.
• Slightly slanted and black bars (approximately 5°) and diagonal black squares
(45°) provide spatial frequency response (SFR) at multiple locations.
• Horizontal and vertical tiled square wave bursts (approximately 5°) and square
wave sweeps measure aliasing ratios and resolution in a range from 100 to
1000 lw/ph.
• Other features provide checks for scan linearity, stair-stepping compression
artifacts.
Polarity: Positive image features
Image Contrast: 40:1 typical
Термины:
• Aliasing – The appearance of image artifacts due to limited or diminished
resolution.
• Aliasing ratio – The quantity of image distortion due to aliasing expressed as
the ratio of maximum minus minimum response to the average response within
a burst pattern (a series of line and space features at a slight angle to the image
sensor).
• Image aspect ratio – The ratio of image width to image height.
• Line widths per picture height (lw/ph); resolution features on this chart are
labeled in line widths x 100 per picture height. Note that each line transition is
counted. 2000 lw/ph is equivalent to 1000 line pairs per picture height (lp/ph).
• Resolution – The measure of a camera or imaging component to convey detail.
• SFR (Spatial Frequency Response) – The amplitude response of an imaging
system as a function of relative spatial frequency.
• Spectrally neutral – Spectral power distributions of equal value.
Guidelines for Usage:
This document is not intended to replace the International Standard Document
ISO-12233. However, the following guidelines will aid the first use of this chart.
• The chart should be illuminated uniformly (±10% of center luminance) against
a surround of low reflectance and with a minimum of flare light. The
illuminant should be effectively neutral with respect to either daylight or
tungsten illuminants (ISO-7589). Camera white balance should be adjusted to
provide equal red, green and blue signal levels.
• The camera should be positioned to provide centered, full-frame-height
rendering of the chart’s active area. Use the chart’s framing arrows and
horizontal edges to aid positioning. The camera to test chart distance should be
noted.
• Use the chart’s central zone plate feature to set good focus.
• Set camera lens aperture and exposure time to provide maximum signal from
white areas while avoiding any signal clipping.
• Where possible, image compression features should be disabled.
• Camera output signal should be linearized using the standard reflection camera
OECF (Opto-Electronic Conversion Function) test chart, Applied Image part
number ST-52-RM.
• Line width features can be viewed with any file viewer for an indication of the
visual resolution limits of the device. International Standard Document ISO-
12233 contains instruction regarding a quantitative determination of resolution
limits. Visual and limiting resolution values should be reported in values of
lw/ph.
• Slant-edge features can be analyzed using SFR software freely available
through www.i3a.org. This topic is also described in greater detail in the
International Standard Document ISO-12233.
• Aliasing level is determined using the slanted burst patterns. It is quantified for
each frequency by the ratio of the maximum minus minimum responses divided
by the difference of average maximum minus average minimum within each
frequency burst.
Информация по этой теме:
• International Standard Document ISO-7589, Illuminants for sensitometry –
Specifications for daylight and incandescent tungsten
• International Standard Document ISO-12233, Electronic still-picture cameras
– Resolution measurements
• International Standard Document ISO-14524, Electronic still-picture cameras
– Methods for measuring opto-electronic conversion functions (OECFs)
• Slant Edge Analysis Tool can be found at, www.i3a.org/downloads_iso_tools.html
[lock]600ppi
[download id=147]
720ppi
[download id=148][/lock]
[lock][download id=149][/lock]
к содержанию ↑
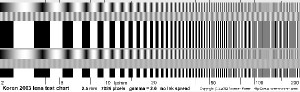
Миры Norman Koren
 srcset="https://new.evtifeev.com/wp-content/uploads/2013/11/Lenstarg_25_7086p_20g_0is-600-300x92.jpg 300w, https://new.evtifeev.com/wp-content/uploads/2013/11/Lenstarg_25_7086p_20g_0is-600-326x100.jpg 326w, https://new.evtifeev.com/wp-content/uploads/2013/11/Lenstarg_25_7086p_20g_0is-600-500x153.jpg 500w, https://new.evtifeev.com/wp-content/uploads/2013/11/Lenstarg_25_7086p_20g_0is-600.jpg 600w" sizes="(max-width: 300px) 100vw, 300px" />
Пространтсвенная частота линий от 2 до 200 lp/mm.
It includes a sine pattern for estimating MTF, a bar pattern for visually estimating sharpness, and contrast reference patterns, which are useful when a film image of the chart is to be visually evaluated.
Each chart is characterized by a length, which is its intended size when imaged on film or a digital sensor. It is printed greatly magnified, 50 to 100x. For example, the chart below is designed to be imaged 2.5 mm (0.0984 inches) long and to be printed 25 cm (9.84 inches) long on letter-sized (8.5×11 inch) or A4 paper— 100x magnification. 5 mm charts are also available.
Several copies of the chart can be printed out and arranged vertically, horizontally, radially or tangentially to make a test target. I recommend using a high quality ink jet printer such as the Epson 1270/1280/1290/2100/2200. Results were inferior on a 600 dpi Hewlett Packard LaserJet.
[lock]к содержанию ↑
Гамма 1.5
ширина: 5906 пикс (25см всего)
[download id=150]
ширина: 7086 пикс (25см всего)
[download id=151]
к содержанию ↑
Гамма 2.0
ширина: 7086 пикс (25см всего)
[download id=152]
ширина: 7086 пикс (50см всего)
[download id=153]
[/lock]
к содержанию ↑
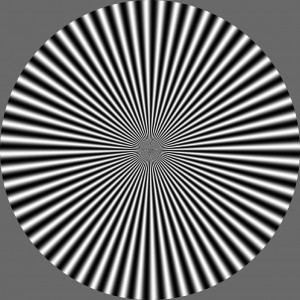
Мира с концентрическими кругами
Описание:
1000×1000 pixel target with concentric cycles with a sinusoidal modulation from black (0) to white (255). The spatial frequency of the 'rings' ranges linearly from zero in the center, to one cycle (somewhat similar to 1 line pair) in the corner. The choice for a continuous tone target was made because it is a closer representation of a discrete quantization of a photographic image, such as from a scannner or digicam, than a bi-tonal pattern. Bi-tonal images, such as line drawings or to a certain extent text, may require different methods for optimal size reduction.
[lock][download id=157][/lock]


")
